Buying Guides
Temperature Rose During a Cold Chain Transfer. How Do You Find Out When?
Everyone has records but the times don’t line up. Mark dispatch, unloading, reloading and arrival on the temperature curve — and keep one logger with the goods across every truck so each leg stays com
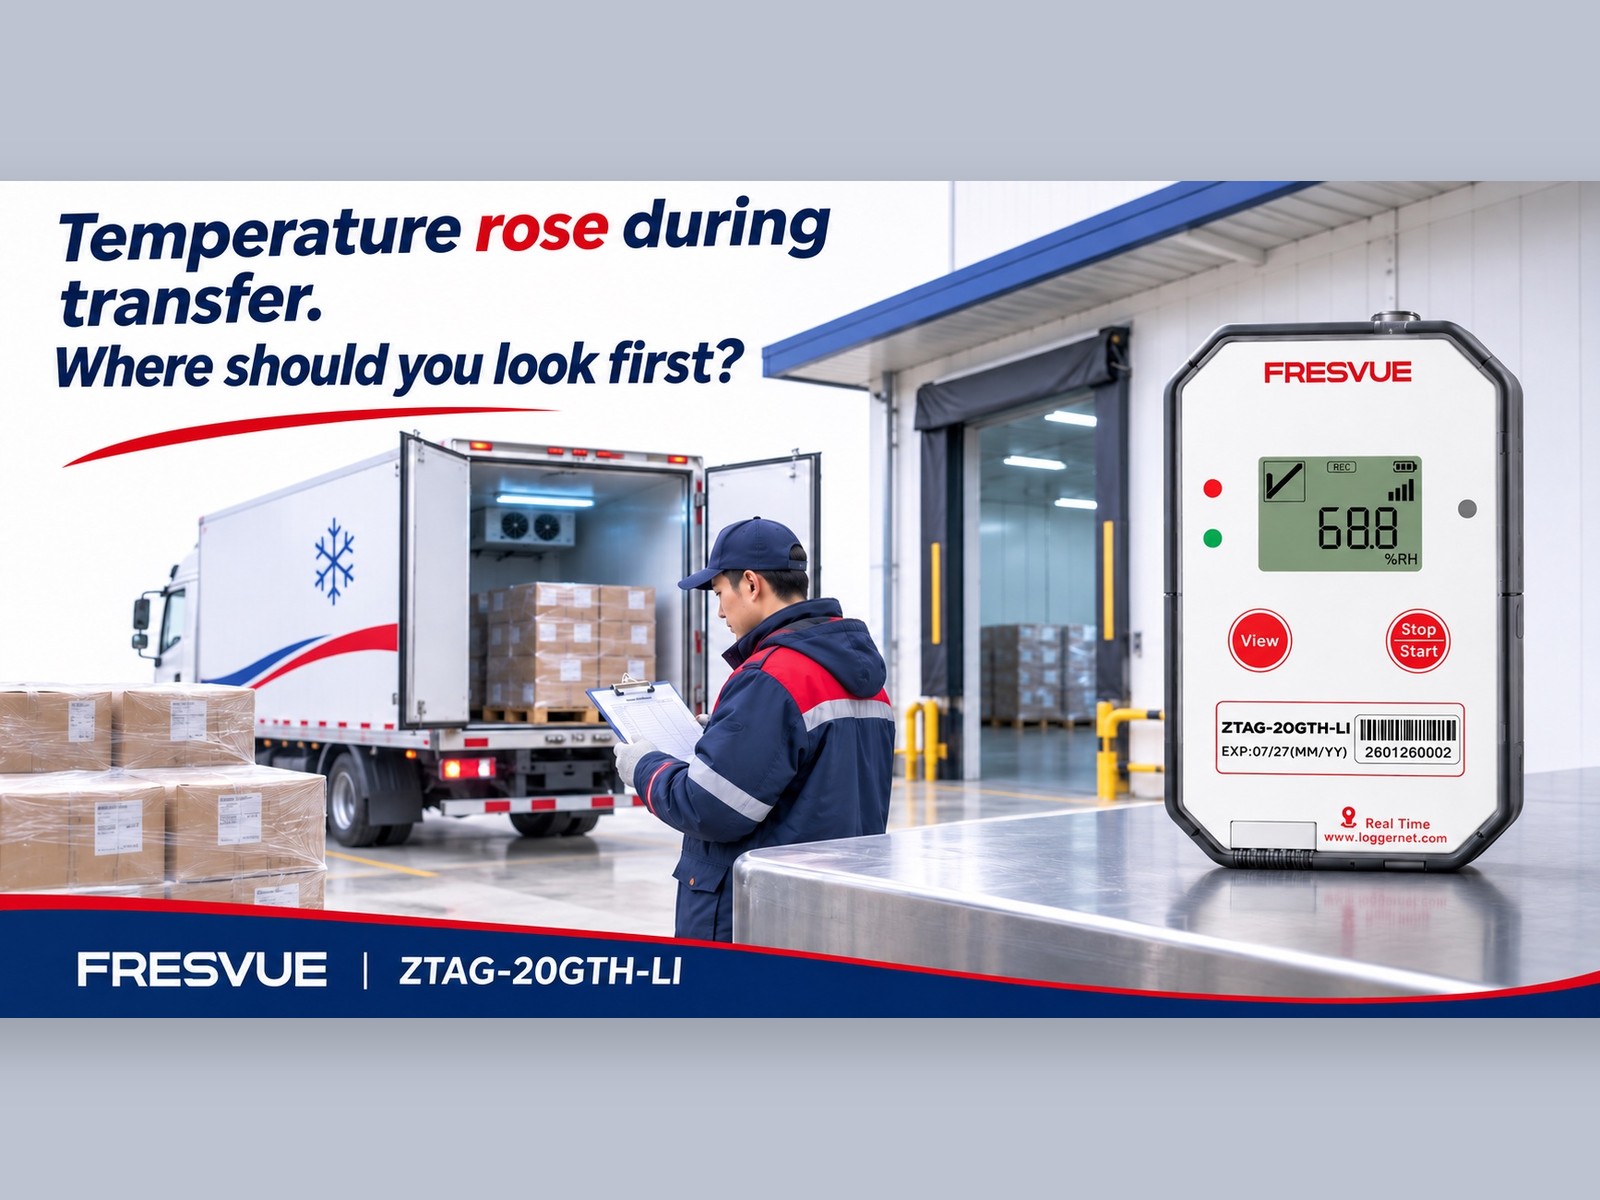
The shipment arrives, and the receiving team spots a clear rise in the temperature record. The warehouse says the temperature was fine at dispatch. The driver says the refrigeration unit ran the whole way. Everyone has records, but the times don’t line up. So when did the temperature start to rise?
Start by lining up the times
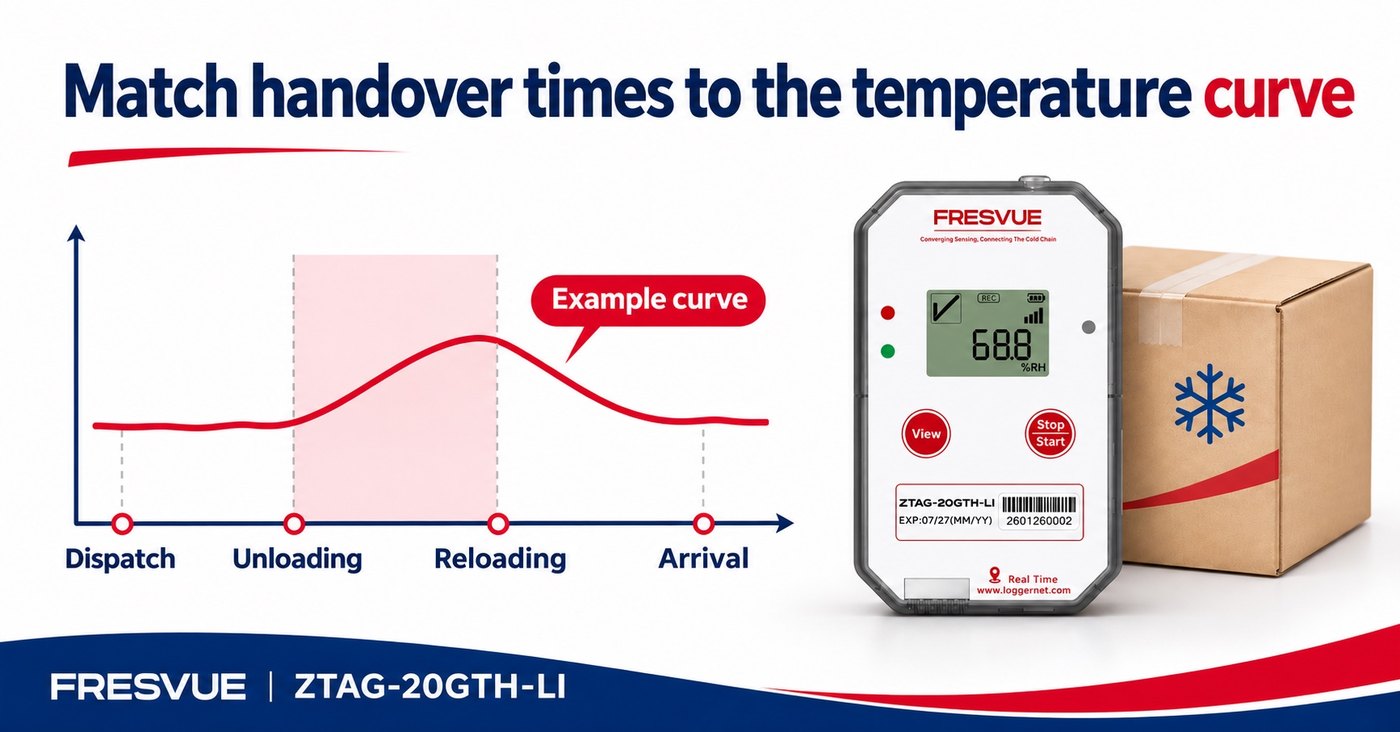
Mark the actual dispatch, unloading, reloading and arrival times on the temperature chart. If the records use different time zones, convert them to one. If a handover form was signed later, ask the people on site when the transfer actually happened. For readings uploaded after a network outage, use the time the logger took the reading.
Say the temperature started rising after unloading and gradually came back down after reloading. Start by checking how long the shipment waited at the dock and where it was held. If the temperature kept rising after reloading, check where the goods were placed in the truck and review the refrigeration unit’s operating records. The curve shows you where to start looking. The handling records help you work out what happened. For fresh produce shipments, see the UNECE Code of Good Practice for Handling Fresh Fruit and Vegetables.
When the shipment changes trucks, keep the logger with it
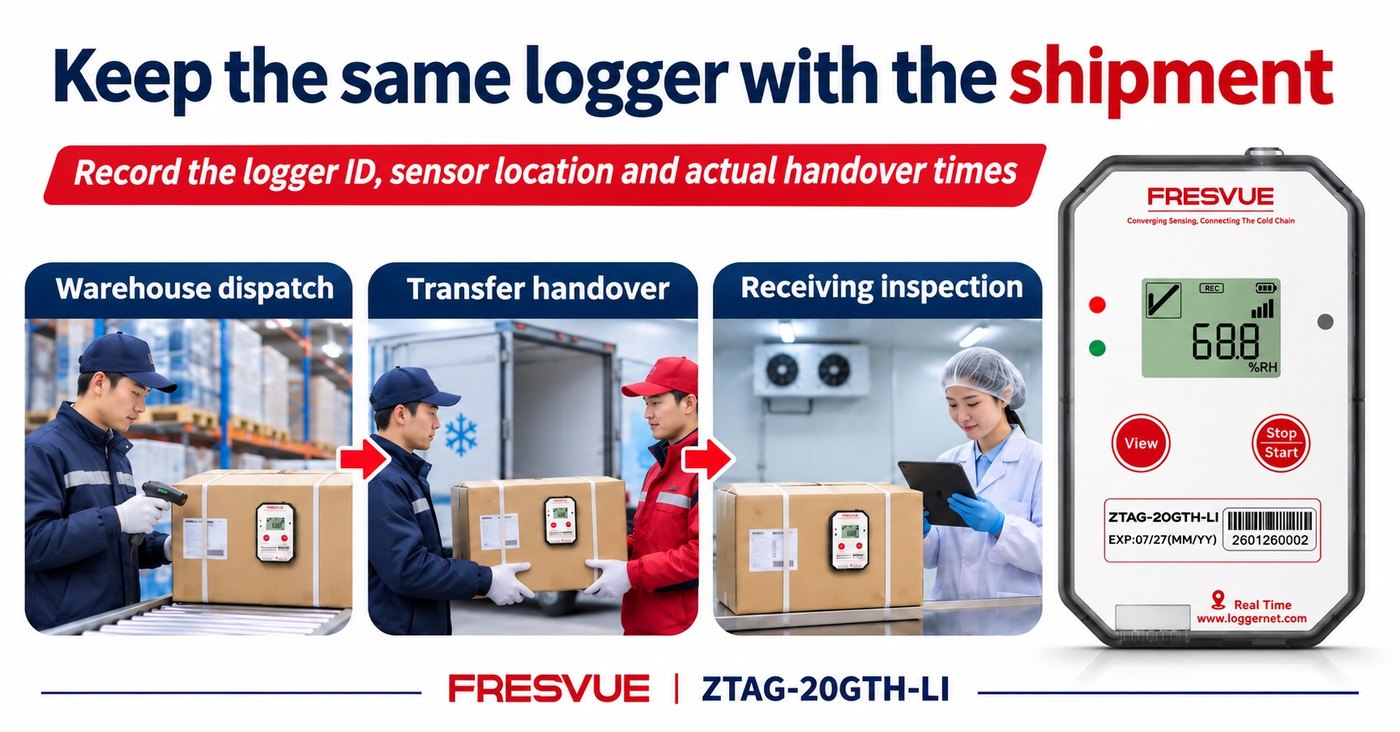
If a shipment changes trucks several times, the FRESVUE ZTAG-20GTH-LI Single-Use Real-Time Temperature & Humidity Data Logger can travel with the same goods from dispatch to receiving. Before dispatch, record the shipment reference, logger ID and where the device is placed. At each handover, note the actual transfer time. For more on documenting logger placement, see the UF/IFAS guide to protecting perishable foods during transport.
When mobile coverage is available, your team can view readings in the cloud. If coverage drops, the logger keeps recording locally and automatically uploads stored readings when the connection returns. At delivery, you can compare one temperature record with each transport leg and the time the shipment spent waiting between trucks.