Why a frozen shipment can warm up without anyone noticing
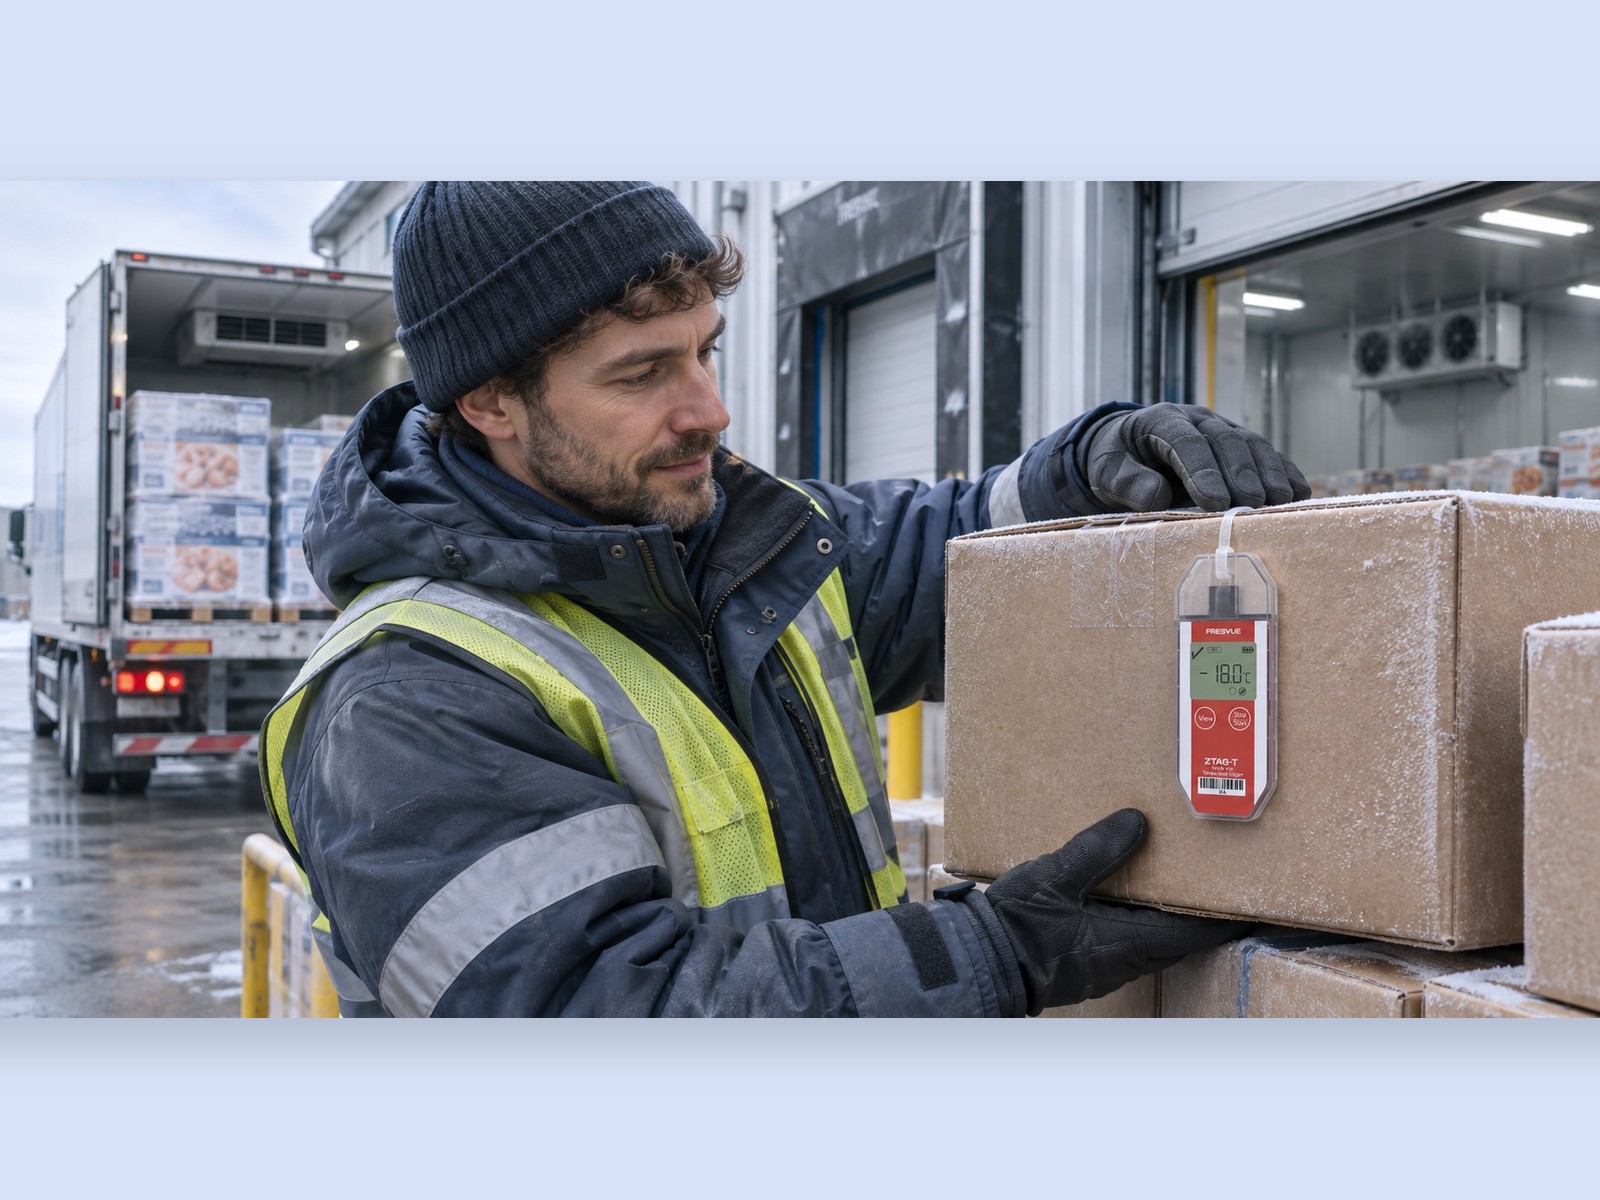
A frozen food shipment can warm up and cool back down without leaving a trace — unless a logger was riding along. The cartons look fine at receiving. The surface temperature checks out. But between dispatch and delivery, the shipment changed trucks, waited on a loading dock, sat through a door left open, or went through a reefer defrost cycle. Each of those moments is a chance for the temperature to climb, and none of them shows on the outside of the box. That is the gap a temperature logger closes. A spot check at receiving only tells you the temperature at that moment. A logger tells you the whole story: when the temperature rose, how high it went, how long it stayed there, and whether it came back down before arrival. Without that record, a warm-up during a transfer is invisible — and if the customer later finds a quality problem, there is no way to show where it happened, or to prove it did not happen on your leg of the journey. The risk is highest at handovers. A reefer truck holds its setpoint well while it is running. The vulnerable minutes are the ones in between: the dock wait while one truck is unloaded and the next is loaded, the doors open during a cross-dock, the container sitting in the sun at a port. Those are exactly the moments a driver may not mention, because nothing looked wrong at the time.
Excursion or harmless blip? How to read the chart
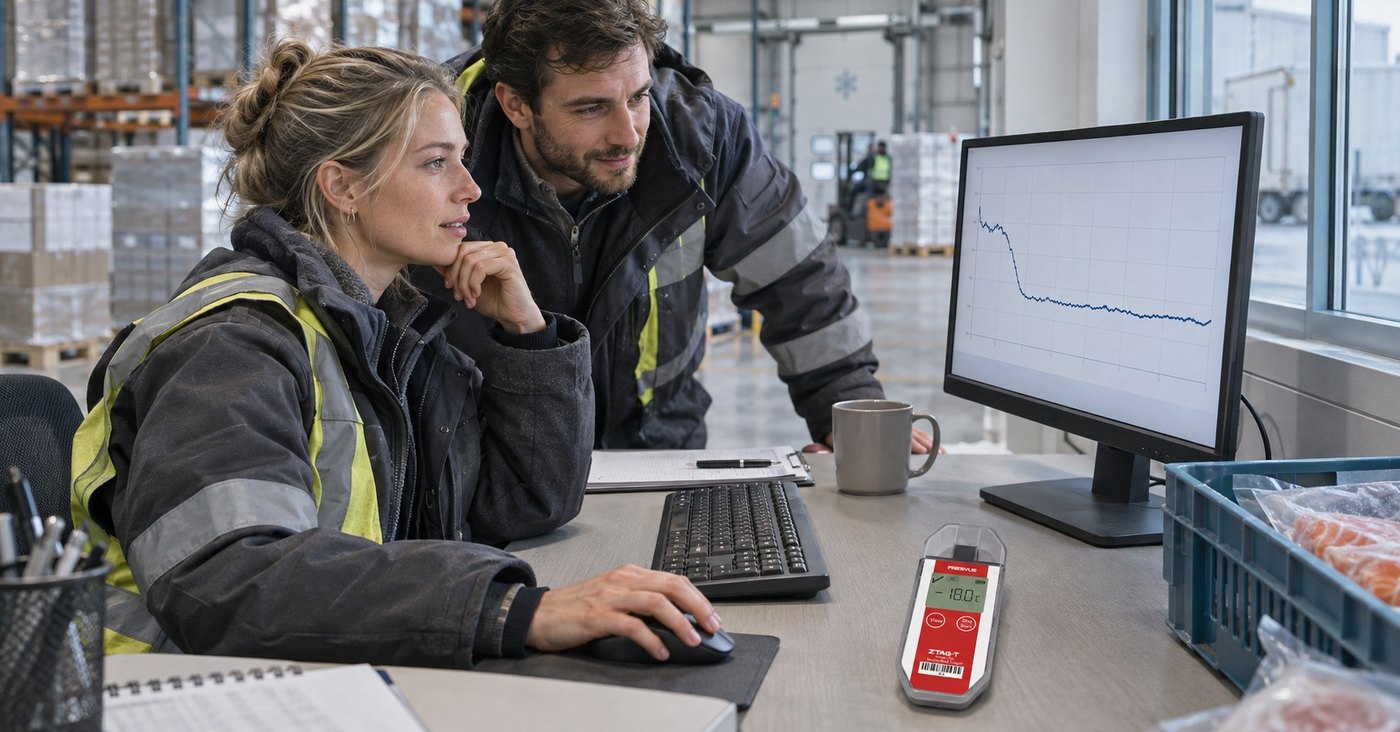
Not every spike on the chart is a problem. Learning to tell the difference saves good shipments from being rejected — and stops bad ones from being accepted. A harmless blip is short and shallow: the temperature rises a few degrees for minutes, usually during loading or unloading when the doors are open, then comes straight back down. The product temperature barely moves, because a frozen carton has thermal mass — it takes time to warm through. If the chart shows a brief rise at the start or end of the trip and the rest of the line is flat at the setpoint, that is normal handling, not an excursion. A real excursion is different in two ways: height and duration. The temperature crosses the agreed limit and stays there. An hour above the limit is a different matter from ten minutes, and a rise that happens mid-voyage — far from any loading activity — points at the refrigeration, not the doors. Use the logger's time stamps to match the rise against the shipment records: when did the truck change, when was the shipment on the dock, when did the reefer report a fault? If the rise lines up with a transfer, the handover is where to look.
What to document. For any excursion, note four things: the highest temperature reached, the time it crossed the limit, how long it stayed above the limit, and what the shipment records say was happening at that time. Keep the logger's PDF report with the receiving record. If a claim follows, that report — not anyone's memory of the day — is the evidence.
Which logger fits a frozen food shipment?
| Logger | Best for | Temperature range | Humidity | How you get the data |
|---|
| ZTAG-T | Everyday frozen food export, cost-sensitive volume lanes | -30°C to 70°C | No | Plug into any computer, PDF/CSV report generates automatically. |
| ZTAG-TH | Shipments where humidity matters as well as temperature | -30°C to 70°C | 0–100%RH | Plug into any computer, PDF/CSV report generates automatically. |
| ZTAG-20GTHS-LI | High-value lanes where you need an alert while the shipment is still moving | -20°C to 70°C | 0–100%RH | Live to the cloud over 4G, email and app alerts, cloud PDF reports. |
| ZLOG-20GTHS-LI | Repeated lanes and warehouses where the logger comes back and is used again | -20°C to 70°C | 0–100%RH | Live to the cloud over 4G, rechargeable, two-year service life. |
| ZTAG-90T | Dry-ice shipments and ultra-low cargo | -90°C to 70°C | No | Plug into any computer, encrypted PDF report. |
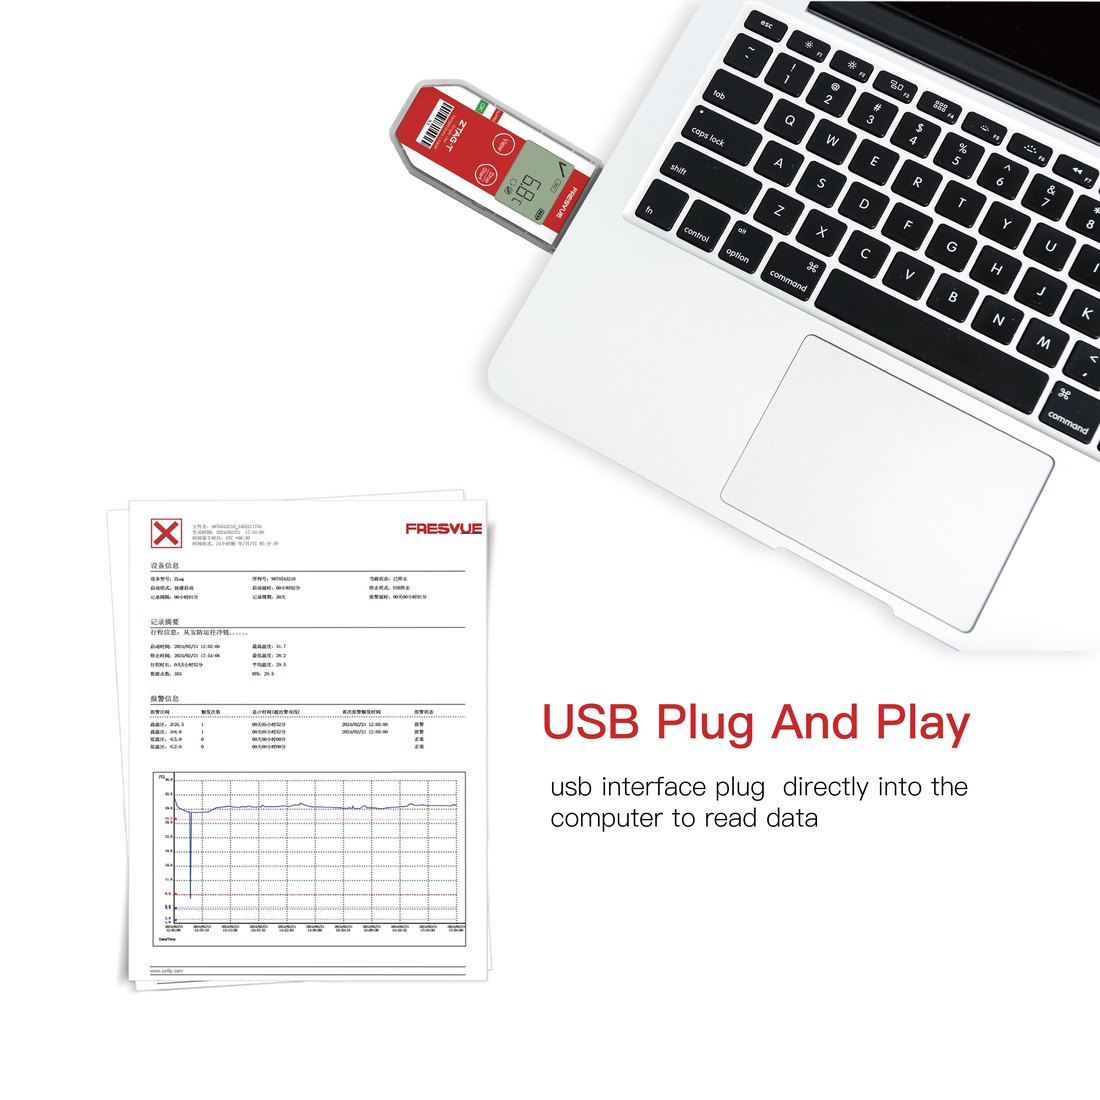
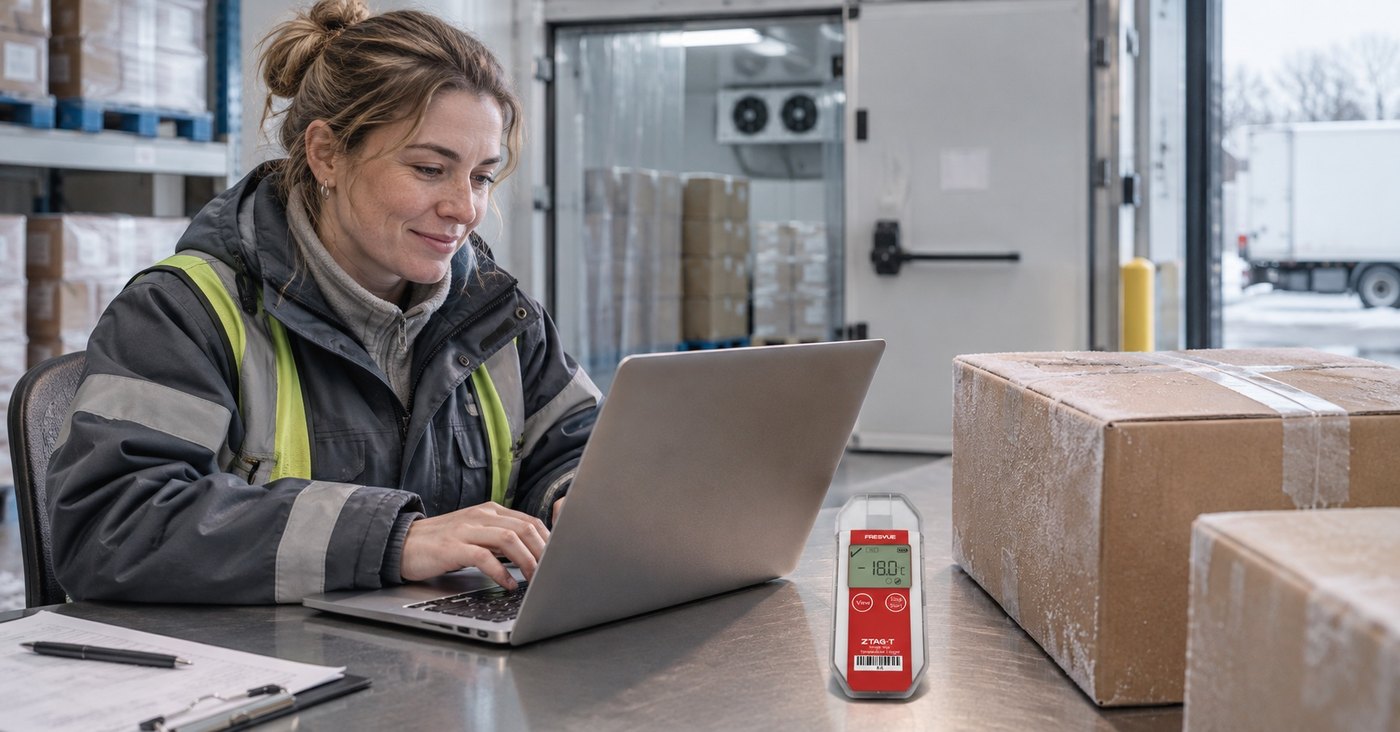
The ZTAG-T is the workhorse for most frozen food shipments: single-use, one-click start, no software, and the receiving team reads the report by plugging it into any computer. Add humidity monitoring with the ZTAG-TH when condensation or moisture matters — for example, on long ocean lanes where the container breathes. And when the cargo is valuable enough that you want to know about a problem while the truck is still on the road, the real-time ZTAG-20GTHS-LI sends an alert the moment a threshold is breached, instead of telling you after delivery. For lanes where the logger comes home every time, the reusable ZLOG-20GTHS-LI does the same job across many trips. If you are weighing single-use against reusable for your network, see our guide: Single-Use vs Reusable Temperature Data Loggers.
Frequently asked questions
The chart shows a spike during loading. Should I reject the shipment?
Usually not on that alone. A short rise while the doors are open is normal handling. Check how high it went and how long it lasted, then measure the product temperature in several cartons. Reject or quarantine only if the product temperature is above the limit or the excursion lasted long enough to matter.
How do I prove a claim with the logger report?
Keep the PDF report with the receiving record and note the four facts: highest temperature, when it crossed the limit, how long it stayed above it, and what the shipment records say was happening then. The report is time-stamped and tamper-evident, which is what a claim handler or insurer asks for.
Can one logger cover a full container?
One logger covers one temperature zone, which is enough for a standard single-setpoint container. For large loads, mixed products, or containers with more than one zone, use one logger per zone — and put the logger where the receiving team can find it, with its ID and location noted at dispatch.
Will the logger keep working in a -25°C container?
Yes. The ZTAG-T is rated from -30°C to 70°C, so a -25°C container is inside its range. Cold shortens battery life, so use a fresh logger for each shipment and confirm the expected monitoring duration for very long lanes.
What if the receiving team has no software?
They do not need any. The ZTAG-T and ZTAG-TH generate their PDF or CSV report automatically when plugged into any computer — no software to install, no reader to buy, no account to log into.